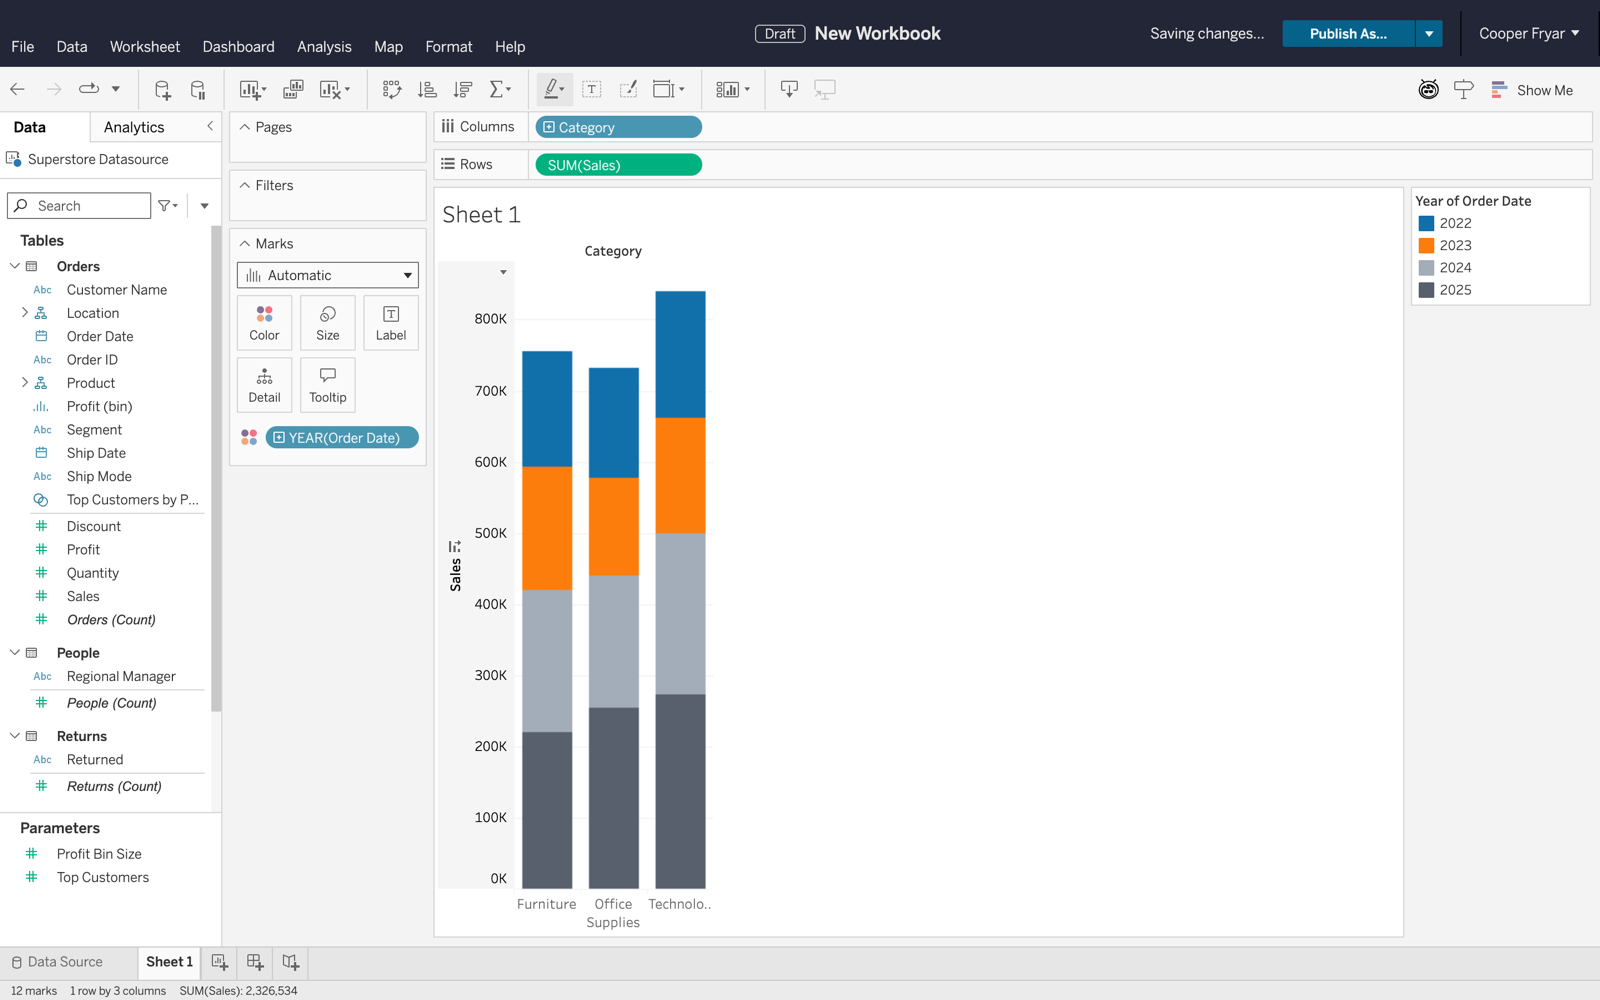
One artifact from each half of the project: a chart authored entirely by wire commands against the standard Superstore dataset, and two pages from the reverse-engineered protocol reference that made it possible.
Authored by wire · zero clicksSales by category and year, live in Tableau Cloud: field drops, a color shelf assignment, and per-value palette commands, with the authoring UI untouched.
Protocol reference · the drag, as a commandFrom PROTOCOL.md: the wire command behind every drop-on-shelf, fired straight from Python through the dispatcher located by signature.
[sqlproxy.<datasourceId>]
  .[<role>:<DisplayName>:<key>]

role  none | sum | avg | count | attr
key   per-field two-letter id, not a type

Quantity → columns-shelf  [sum:Quantity:qk]
Quantity → pages-shelf    [sum:Quantity:ok]
Protocol reference · field encodingThe decoded field grammar. The same field resolves to a different key depending on its target shelf, which is exactly why naive replays fail.
The Problem
The UI is the only API
Tableau's REST APIs manage content: they publish workbooks, list users, and move projects around. Authoring is a different story. There is no supported way to create a worksheet, drop a field on a shelf, add a filter, or compose a dashboard from code. Every chart in Tableau Cloud is built by a person, clicking.
That gap rules out templating, mass production, migration tooling, and conversational authoring. It also pointed at the workaround. If the UI is the only client that can author, then whatever the UI says to the server is a protocol. Learn the protocol, and code can author too.
Three ways into Tableau Cloud: management is public, authoring does not exist, and the UI's own wire traffic is the way through.
The Method
Capture and Replay
Everything runs through Playwright over the Chrome DevTools Protocol against a signed-in browser session, so each experiment happens in the same environment a real analyst uses. From there the work followed a repeatable discovery loop:
01
Watch
Instrument the session and log the internal wire commands (the tabdoc and tabsrv families) that Tableau's UI dispatches while a human builds a chart by hand.
02
Hunt
Search Tableau's minified in-page modules for the dispatcher that executes those commands, and pin down how to reach it from injected JavaScript.
03
Capture
Perform one authoring action at a time and diff the traffic to isolate the exact command and payload behind that single click or drag.
04
Replay
Fire the same command from Python, confirm the viz actually changes, then catalogue it so the discovery never has to be made twice.
The catalogue grew into PROTOCOL.md, a map from every authoring operation to its exact wire command, complete with hard-won debugging heuristics like "zero drop targets means your field reference is encoded wrong."
See it in motion
One loop of the method: watch a human drag, capture the command it fired, replay it from Python.
Breakthroughs
Three discoveries that made it work
Dispatcher by signature
Tableau's build pipeline renames every internal symbol on each release, so hardcoded paths die fast. The bridge finds the command dispatcher by behavior instead: it walks out from a stable crash-reporting hook and looks for the object exposing executeSingleRemoteCommand. New release, new names, same signature. Still works.
The 500 ms flush
Wire commands mutated server state but the canvas stayed stale, and the first workaround (reloading the sheet) cost about 3 seconds per operation. Tracing the SPA's command coordinator exposed a queue of deferred server responses and the method that flushes it. Calling that flush re-renders the viz in under 500 ms, which is what makes authoring by wire feel instant.
Field encoding, decoded
Fields travel as [sqlproxy.<datasource>].[<role>:<Name>:<key>], and the same field encodes differently depending on which shelf it targets. Decoding that scheme unlocked reliable drops. A bonus find: one universal delete command covers calculated fields, bins, groups, sets, and parameters alike.
Coverage
The authoring surface
Roughly 90 typed Python primitives now cover the surface an analyst actually uses:
Analytics objects: reference and trend lines, bands, box plots
Per-value colors, palettes, dual axis, totals and subtotals
Dashboard composition with filter, highlight, URL, and parameter actions
The proof piece: a four-chart, cross-filtered dashboard, actions wired, built entirely from code with zero clicks.
The target: dashboards that cross-filter each other, composed entirely from code.
Shipping
From research to plugin
The bridge ships as an MIT-licensed Claude Code plugin. On first run it sets up its own Python environment, installs Playwright, and walks the user through browser login. From there, a non-developer can say "build a sales-by-region bar chart, add a top-10 filter, and put it on a dashboard that cross-filters" and watch it happen live in their own session.
One command · self-installingFirst run builds its own Python environment, installs Playwright, and walks through browser login.
An honest footnote: this is unsupported research against an internal API. It's validated on one pod with the Superstore dataset, and any Tableau release could break it. That fragility is part of the point. The demand for programmatic authoring is real, and this is a working argument that an official API is worth building.